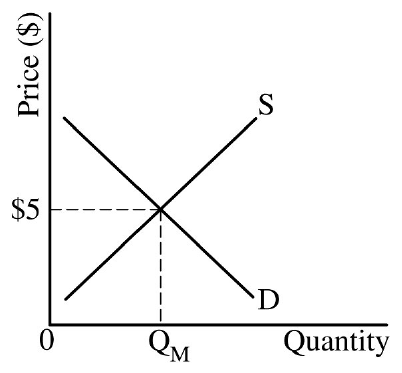
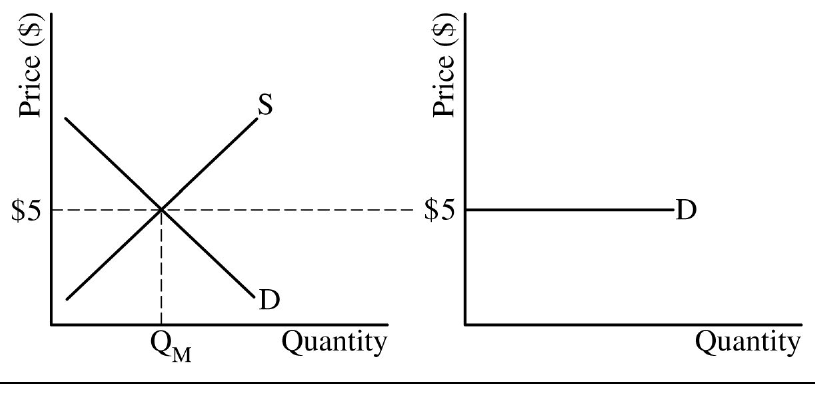
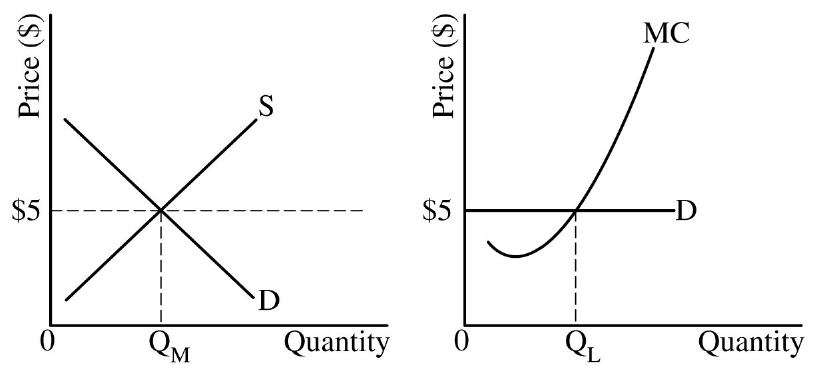
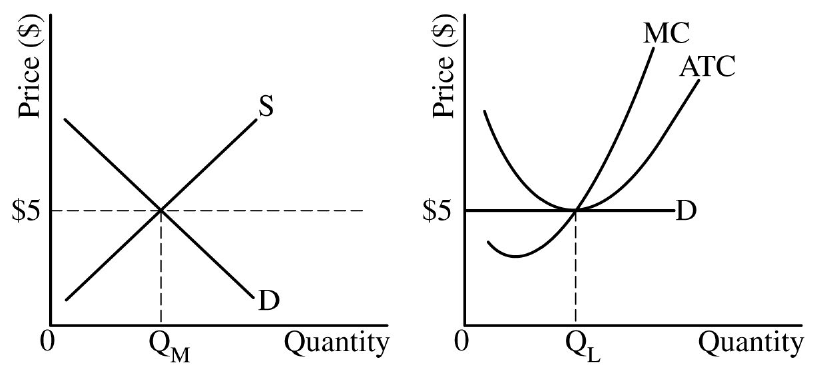
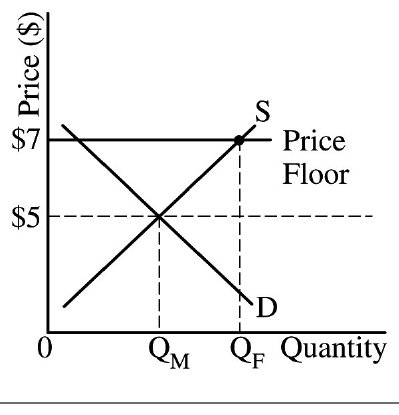
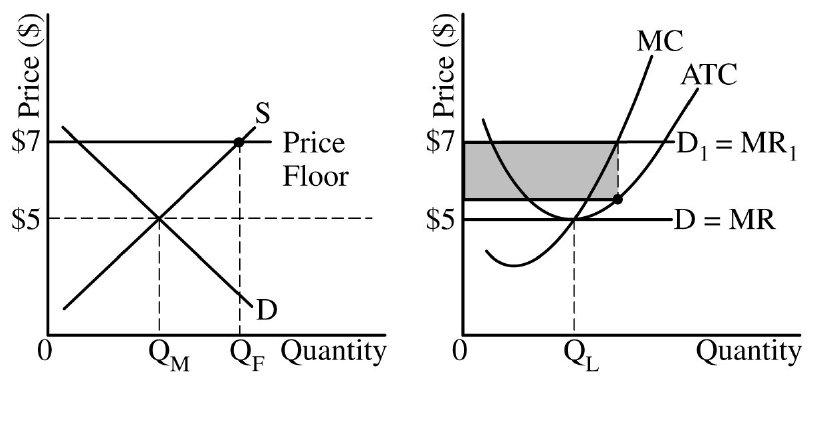
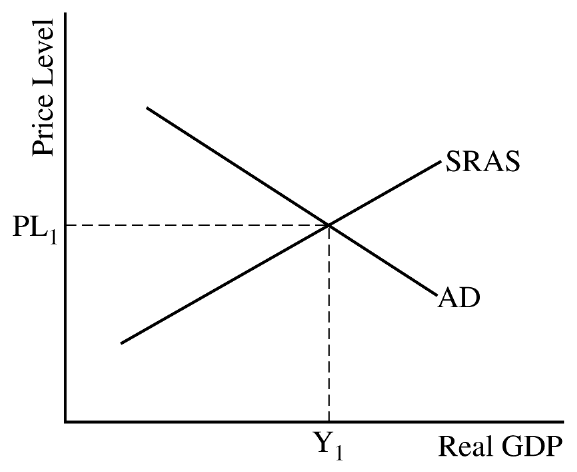
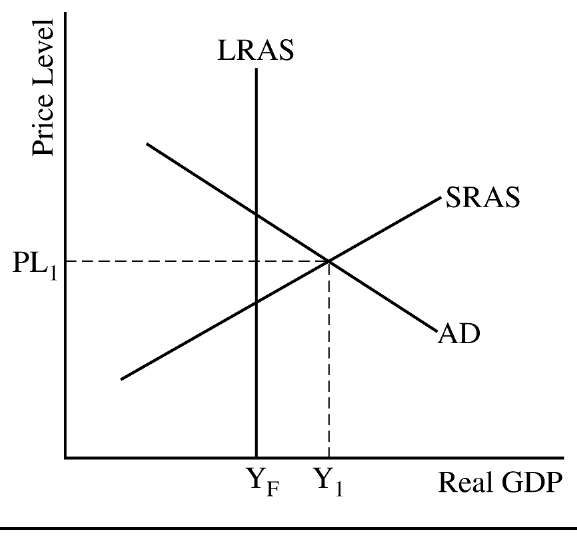
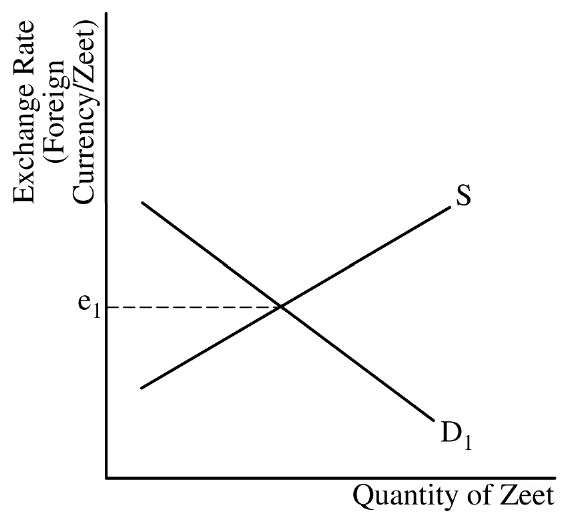
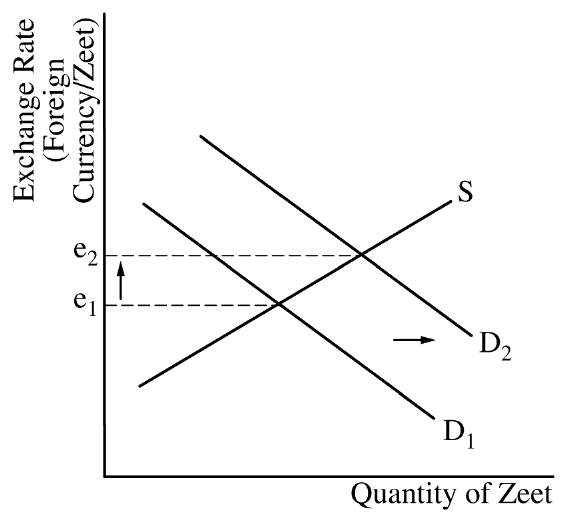
Q1 Long의 30-50%가 그래프이고 그래프는 라벨 누락 시 즉시 감점. → 그래프 라벨 마스터 = 즉시 점수 ↑. → 그래프 체크리스트
② Micro Q1 Long — 10점 완전 분석 (Gratin 감자 시장)
CED Sample Question (p.137)
1. On the island of Gratin, potatoes are produced in a perfectly competitive constant cost industry. The market for potatoes is currently in long-run equilibrium at the market price of $5 per sack.
(a) Draw correctly labeled side-by-side graphs for the potato market and for farmer Lamo and show each of the following.
(i) The market equilibrium quantity and price, labeled QM and $5, respectively
(ii) The quantity produced and the price for farmer Lamo, labeled QL and $5, respectively
(b) Believing that the incomes of potato farmers are unfairly low, the government of Gratin imposes a binding price floor at $7 per sack...
(i) The market quantity of potatoes that would be supplied at the price floor, labeled QF
(ii) The profit farmer Lamo earns, shaded completely
(c) If the absolute value of the price elasticity of demand is 0.92, would consumer spending on potatoes increase, decrease, or stay the same as a result of the price floor? Explain.
(d) How would the price floor affect the demand for labor by potato farmers?
(e) Potatoes, corn, and rice... (i) corn equilibrium price/quantity? (ii) rice/potatoes substitutes or complements?
(a)(i) Draw a correctly labeled graph of the potato market that shows the market equilibrium quantity and price labeled QM and $5, respectively.
Create graphs4.A
1 pt
Draw a correctly labeled graph for farmer Lamo next to the graph of the potato market that shows a horizontal demand curve for Lamo coming from the market equilibrium price of $5.
Create graphs4.A
1 pt
(a)(ii) Show the profit-maximizing quantity QL where P = MC.
Create graphs4.B
1 pt
Show the ATC curve tangent to Lamo's demand curve at QL.
Create graphs4.B
✅ Part (a) 모범 답안 그래프 — College Board CED Scoring Guidelines · Micro p.138
단계별로 그래프를 완성합니다 (4점 = 4단계, 단계마다 1점):
1점Step 1 — (a)(i) 시장 그래프
Y축 Price($), X축 Quantity, S·D, 균형 ($5, QM)
1점Step 2 — (a)(i) Lamo 수요곡선 추가
Side-by-side로 우측에 Lamo 그래프, 시장 균형가에서 horizontal D=$5 점선 연결
1점Step 3 — (a)(ii) MC 추가
Lamo 그래프에 MC 추가, P=MC 지점에 QL 라벨
1점Step 4 — (a)(ii) ATC tangent 추가
ATC가 D=$5에 정확히 tangent (QL 위치 — 장기균형 zero profit)
📌 핵심: 시장 그래프와 Lamo 그래프 사이를 $5 점선으로 가로질러 연결해야 가격 일치 의도가 명확. ATC는 QL에서 정확히 tangent (위·아래 어긋나면 −1점).
Part (a) Total 4 points
Part (b) — 2 points
1 pt
(b)(i) On the graph from part (a), show the market quantity of potatoes that would be supplied at the price floor, labeled QF.
Create graphs4.C
1 pt
(b)(ii) On the graph from part (a), show the profit farmer Lamo earns with the price floor, shaded completely.
Create graphs4.C
✅ Part (b) 모범 답안 그래프 — College Board CED Scoring Guidelines · Micro p.139
1점Step 1 — (b)(i) 시장 그래프에 Price Floor 추가
$7 horizontal "Price Floor" 라인, S 곡선과 만나는 점 QF 표시 (QF > QM)
1점Step 2 — (b)(ii) Lamo profit 음영
새 D1=MR1=$7 horizontal 추가, QL에서 위로 ATC까지 직사각형 완전 음영 (점선 박스만 그리면 −1점)
State that consumer spending on potatoes will increase AND explain that because the demand for potatoes is inelastic, the price increase will result in an increase in total spending. (또는: percentage increase in price outweighs the percentage decrease in quantity demanded)
Explain3.C
Part (d) — 1 point (Make assertion)
1 pt
State that the demand for labor will increase and/or the demand curve will shift to the right.
Make assertion3.B
Part (e) — 2 points
1 pt
(e)(i) State that the equilibrium price of corn will increase AND the equilibrium quantity of corn will decrease.
Make assertion3.B
1 pt
(e)(ii) State that potatoes and rice are substitutes in consumption.
Make assertion2.A
(c) Increase — Demand for potatoes is inelastic (|PED|=0.92 < 1), so the percentage increase in price (40%, $5→$7) outweighs the percentage decrease in quantity demanded → total consumer spending increases.
(d) Increase / shift right — At $7, farmers want to produce QF (more than QM), so the demand for labor (an input) increases / labor demand curve shifts to the right.
(e)(i) Equilibrium price of corn ↑ AND quantity of corn ↓ — corn farmers switch to potatoes (now more profitable), supply of corn decreases, Scorn shifts left.
(e)(ii) Substitutes in consumption — both starches/grains; consumer substitutes one for the other.
💡 이 문제에서 배울 점
✅ 점수 분배 패턴
10점 중 6점이 그래프 (a) + (b). 3점이 단답 assertion (d)+(e). 1점만 Explain (c).
→ 그래프 라벨 정확하면 60% 확보. 단답 assertion 정확하면 추가 30%. Explain 1개만 잘 쓰면 만점.
⚠️ 한국 학생 빈출 감점 (이 문제 기준)
(a)(i): Side-by-side 그래프인데 두 그래프 가격 점선 연결 누락 → −1점
(a)(ii): ATC가 D=$5에 정확히 tangent하지 않음 (위·아래로 어긋) → −1점
(b)(ii): "shaded completely" 명시인데 점선 박스만 그림 → −1점
(c): "Increase"만 쓰고 inelastic 이유 안 적음 → −1점 (Explain task 위반)
(d): 노동 수요 ↑인데 노동 공급 ↑로 잘못 답 → −1점
③ Macro Q1 Long — 10점 (Zeetoland AD-AS + 통화정책)
CED Sample Question (p.141)
1. Assume that the country of Zeetoland is in short-run equilibrium. The expected inflation rate is 4 percent, the actual rate of unemployment is 5 percent, the natural rate of unemployment is 6 percent, and the equilibrium real interest rate is 3 percent.
(a) Draw a correctly labeled graph of the AD, SRAS, and LRAS curves for Zeetoland, and show:
(i) The current equilibrium real output and price level, labeled Y1 and PL1
(ii) The full-employment output, labeled YF
(b) Assume no policy action is taken to address the output gap. Explain how the economy will adjust to full employment in the long run.
(c) Assume instead that the central bank is concerned about inflationary pressures... identify one monetary policy action the central bank would likely take.
(d) How would the monetary policy action identified in part (c) affect each of the following in the short run?
(i) The price of previously issued bonds in Zeetoland
(ii) Real output in Zeetoland. Explain.
(iii) Net financial capital flows to Zeetoland. Explain.
(e) Draw a correctly labeled graph of the foreign exchange market for Zeetoland's currency, the zeet, and show the effect of the monetary policy action on the demand and the exchange rate for the zeet.
(f) Based on the change in the value of the zeet shown in part (e), what will happen to Zeetoland's exports? Explain.
Contractionary 통화정책 1개 식별. 예: "Increase the interest on reserves" (US Fed의 ample reserves 체제에서 가장 표준), "Sell government bonds" (open market sale), "Increase the discount rate" 등.
Make assertions3.A
Part (d) — 3 points
1 pt
(d)(i) Bond 가격 하락 (이자율↑이면 기존 채권 가격↓ — 역관계).
Make assertions3.A
(b) Adjustment — 정책 개입 없이 장기에 SRAS가 좌측 이동 (decrease). 이유: nominal wages·input prices·inflationary expectations 상승. 결과 PL ↑, Y → YF로 복귀.
(c) Contractionary monetary action — 다음 중 하나: (i) Increase the interest on reserves (US Fed 표준), (ii) Sell government bonds (open market sale), (iii) Increase the discount rate.
(d)(i) Bond price ↓ — 이자율 ↑ ↔ 기존 채권 가격 ↓ (역관계).
(d)(ii) Real output ↓ + Explain — 이자율 ↑ → 투자(I) ↓ → AD ↓ → Y ↓.
(d)(iii) Net financial capital flows to Zeetoland ↑ + Explain — Zeetoland 이자율 ↑ → 외국 자본의 Zeetoland 자산 매입 유리 → 자본 유입 ↑.
(f) Exports ↓ + Explain — Zeet appreciation 으로 외국인이 보기에 Zeetoland 상품·서비스가 다른 국가 대비 상대적으로 비싸짐 → 외국 수요 ↓ → 수출 감소.
✅ Macro Q1 Long 점수 분배 패턴
3-4점 그래프 + 1-3점 단답 assertion + 3-4점 Explain. AD-AS, FX 그래프 마스터 + 통화정책 → 거시변수 사슬 reasoning이 핵심.
⚠️ 한국 학생 빈출 감점
(a): YF 위치를 LRAS와 같이 두지 않음 → −1점
(b): "장기에 균형 회복"만 쓰고 SRAS 이동 메커니즘 안 적음 → −1점
(d)(i): "이자율↑ → bond price ↓" 인과 관계 헷갈림
(e): Y축 단위 ("dollars per zeet" vs "zeets per dollar") 모호 → −1점
(f): "수출 감소"만 쓰고 환율 변화 메커니즘 안 적음 → −1점
④ Q2/Q3 Short — 5점 패턴 (각각 5점, 짧은 답)
Short FRQ는 Long보다 단순해서 각 sub-part = 1점 패턴이 일반적입니다. 보통 5개 sub-part (a-e). 그래프 작성보다는 단답 assertion + 간단 Explain + Calculate 위주.
Micro Q2 Short Sample (Question p.134 / Scoring p.141-142 — Game Theory)
Sample Question
Two discount stores, Discount Delight and Bargain Floor, sell athletic shoes. Payoff matrix shown (Includes/Does Not Include 2×2). Two firms know all info, do not cooperate.
(a) If Discount Delight does not include the shoes but Bargain Floor includes, what will Bargain Floor's profit be?
(b) Does either player have a dominant strategy? If so, identify the player and the strategy.
(c) Using numbers from the table, explain why both stores choosing not to include does NOT correspond to a Nash equilibrium.
(d) Identify the Nash equilibrium strategy for each store.
(e) If the two stores could cooperate, would the outcome change? Explain.
5점 분배 (CED p.142 원문)
(a) 1pt: $250 (matrix에서 Discount Delight=Not Include, Bargain Floor=Include 셀 → Bargain Floor 보수 $250) Perform numerical analysis1.C
(b) 1pt: "Yes, Bargain Floor has a dominant strategy of Includes" (Bargain Floor는 상대 선택과 무관하게 Includes 시 더 큼: 180>100, 250>220) Perform numerical analysis1.C
(c) 1pt: 두 stores 모두 Not Include 셀 ($240, $220) 에서 한쪽이 Includes로 옮기면 보수가 증가 (Discount Delight: 240→? Bargain Floor: 220→250) → Nash equilibrium 아님. 매트릭스 숫자 인용 필수Explain2.C
(d) 1pt: 두 stores 모두 Includes (Includes, Includes) → ($150, $180) Perform numerical analysis2.C
(e) 1pt: "Yes, outcome would change" + Explain — 두 stores가 합의로 Not Include를 선택하면 양쪽 모두 이익 증가 (240>200 또는 240>150 / 220>180 또는 220>100). 즉, 협조 시 (Not Include, Not Include) = ($240, $220) 이 Nash 결과 ($150, $180) 보다 양쪽 다 좋음. Explain3.C
✅ Micro Q2 Short 모범 답안 — 한 줄 정리 — Scoring Guidelines · Micro p.141–142
(a) $250
(b) Yes — Bargain Floor의 dominant strategy는 Include (180>100 AND 250>220)
(c) (Not Include, Not Include) = ($240, $220)에서 Bargain Floor가 Include로 바꾸면 220→250으로 이득 → 일방 이탈 유인 존재 → Nash 아님
(e) Yes — 협조하면 (Not Include, Not Include) = ($240, $220) 채택 가능, 두 stores 모두 Nash 결과보다 이득
📌 핵심: Game Theory 표는 그래프가 아니므로 별도 정답 그래프 없음. (c)·(e)는 반드시 매트릭스 숫자 인용으로 Explain.
Macro Q2 Short Sample (Question p.139 / Scoring p.145-146 — Real GDP/Inflation 계산)
Sample Question
The table shows macroeconomic statistics for Fehran (Year, Nominal GDP, Tax Revenues, Government Outlays, Consumption Spending, Population, GDP Deflator). 2011 / 2012 데이터 제공.
(a) Calculate (show your work):
(i) Fehran's real GDP in 2012
(ii) Inflation rate from 2011 to 2012
(b) Fehran is the only producer of electric vehicles... would foreign importers buy more or fewer in 2012? Explain.
(c) Did the standard of living increase, decrease, or stay the same between 2011 and 2012? Explain.
(d) What effect will the changes in Fehran's government budget have on Fehran's national debt? Explain.
5점 분배 (CED p.146 원문)
(a)(i) 1pt: Real GDP 2012 = 225,000/125 × 100 = $180,000 + work shown Perform numerical analysis1.C
(b) 1pt: Fewer + Explain (Fehran 가격 ↑ vs trading partners → Fehran 상품이 외국인에게 상대적으로 비싸짐 → demand for Fehran exports ↓) Explain2.C
(c) 1pt: 계산 — Real GDP per capita 2011 = 150,000/100 = $1,500; 2012 = 180,000/120 = $1,500 → 동일 (no change) + Explain (real GDP per capita 변동 없으므로 standard of living 변화 없음) Explain2.C
(d) 1pt: National debt 증가 + Explain (2012 government outlays $35K > tax revenues $30K → 적자 발생 → debt 증가) Explain3.C
(b) Fewer — Fehran 물가가 25% 상승 → 외국 trading partners 입장에서 Fehran 전기차가 상대적으로 비싸짐 → 외국인의 Fehran 수출 수요 ↓.
(c) Stay the same: Real GDP per capita 2011 = 150,000 / 100 = $1,500 Real GDP per capita 2012 = 180,000 / 120 = $1,500 → 변화 없음. 평균 생활수준 (real GDP per capita) 동일 → standard of living 변동 없음.